


Category Archives: Sandshed Science
- Home
- Archive by category "Sandshed Science"

loading...
King Tides
King Tides and Future Sea Level Rise
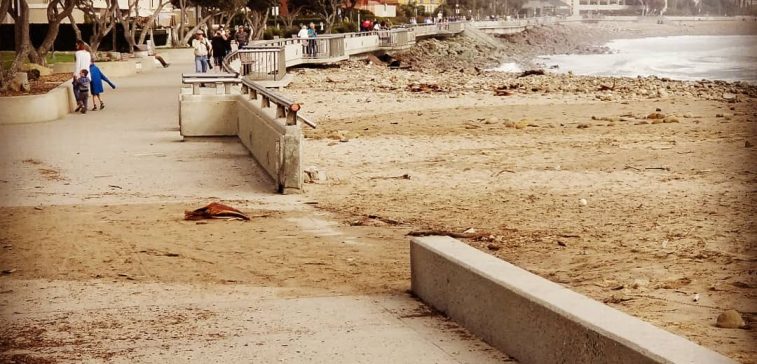
Check out the great memorandum put out by my friend Dave Revell, with Revell Coastal, explaining King Tides. I urge you all to get out early on Sunday and Monday (January 20 and 21, 2019) to experience the king tides at the coast near you. Remember, this is a good way to experience how a "typical" tide will flood surrounding areas with ~1.5 feet of sea level rise on a routine high tide, which is a reasonable estimate for sea level rise in the next 20 years.
You can also be a part of the California Coastal Commission's active citizen science project and submit your own pictures of the king tide. Follow this link: https://www.coastal.ca.gov/kingtides/ to learn more about king tides and submit your pictures.
Da te: January 19, 2019
To: Interested Citizens of Southern California
From: Potential King Tide Photo Spots in SoCal in December 2018
Purpose
To respond to many requests from respected colleagues and news outlets interested in helping to monitor potential sites that are likely to be exposed to flooding from an extremely high “King” tide. The highest high tides follow the full moon cycle and are predicted to occur on the mornings of January 20th and 21st, 2019.
Background
A “King tide” is also known as a perigean spring tide, when the moon in the winter reaches its nearest orbit to the earth and thus exerts its largest gravitational pull on the ocean water levels.


A king tide with no storms identifies places that will be routinely vulnerable to sea level rise first. A king tide with high waves can cause extensive wave flooding and coastal erosion. A king tide with a rain event can also back up stormwater during rain events and cause increased ponded flooding. No large wave or rain events are predicted with this king tide series.
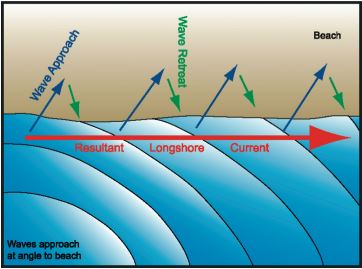
On the US West Coast erosion and coastal hazards are caused by large storm wave events and total water levels not only high tides. Total water levels are the combination of wave run-up, and high tides, NOT storm surge (which can be 20 feet in a major hurricane on the East and Gulf Coasts versus 3 feet on the West Coast). A king tide provides a good example of what would be flooded by ~1.5 feet of sea level rise on a routine high tide and is about 1.5 to 2 feet above a normal high tide (Mean High Water is the average of all high tides over a 19 year period is the public-private boundary in CA). High tides though do play an important role in beach ecology affecting where certain species can safely nest, overwinter, and lay eggs. In locations where coastal armoring (seawalls and revetments) are prevalent, king high tides can flood beaches, inundate unprotected stormwater and wastewater systems which tend to be gravity fed and restrict access and coastal recreation.
Forecast
This high king tide series in December is forecast to have minimal wave energy during this tide series which makes this less exciting yet still important to document. The key locations to document impacts would be those that will be routinely impacted by sea level rise in the next 20 years. My prediction based on wave conditions is that there will not likely be large flooding or coastal erosion, but rather certain areas will be flooded and highlight areas that will pose future transportation bottlenecks, nuisance property flooding, illustrate future loss of beaches in areas of heavy coastal armoring and illustrate critical infrastructure that will likely be isolated from maintenance and emergency repair crews.
What to look for
Missing beaches that have coastal armoring on the backshore which demonstrate the impact of coastal squeeze (loss of beach due to coastal armoring and sea level rise = loss of our public trust resources)
Flooded roadways or runways that may hinder future evacuation
Completely full estuaries that show little to no vegetation around the edges (while this is an important process to accrete sediment, it demonstrates there is nowhere left for these ecosystems to evolve)
Open mouthed lagoons are affected by tides and thus inland development fringing those lagoons (probably delayed by an hour or two from peak high tide). If a barrier beach is present then probably not worth the time.
Locations in southern California (Imperial Beach to Point Conception) South to North
Specific locations (* potentially dramatic and news story worthy)
San Diego
Imperial Beach
South Sea Coast Drive*
Bayview School and the South Bay Bikepath on San Diego Bay
Helicopter Base in Tijuana River Valley
North County lagoons
Beaches on Del Mar* (important to show the loss of beach amidst the controversy around managed retreat)
Low lying beach areas in Coronado, Mission Bay, Encinitas, Carlsbad, and Oceanside
Orange County
Beaches in San Clemente
Capistrano Beach
Newport Bay – Balboa Island*, upper Newport Bay
Huntington Beach Wetlands including access to the rebuilt power plant and proposed Desalination Plant site*
Seal Beach wetlands (Sunset and Los Alamitos Bay) and fronting development
Los Angeles County
Long Beach and LA Harbors
Ballona Wetlands
Venice Beach Canals*
Malibu Beach Adamson House
Broad (No) Beach*
Ventura
South County PCH particularly state park beaches at Sycamore Cove, and campgrounds at Point Mugu State Park
Mugu wetlands and the Naval Base Ventura County runways, beaches, and wetlands*
Oxnard J Street Drain
City of Port Hueneme Beaches
Channel Islands Harbor (inside) – South Victoria Avenue near Lakeshore Ct. (evacuation route)
Pierpont Bay Community
Sanjon Barranca (if open)
Surfer’s Point restoration versus Ventura Promenade (managed retreat vs hold the line)*
Rincon Parkway (no beaches)
Rincon Creek
Santa Barbara
Contrast the beach between City of Carpinteria Beach with Sandyland Cove*
Carpinteria Salt Marsh
Potentially inundation on the North End of Ash Avenue
Beach fronting Sand Point Road with unpermitted revetment
Beach in front of Channel Drive in Montecito
SB Waterfront (in particular Laguna Channel and the tide gate)
Goleta Beach County Park (now completely armored)*
Goleta Slough (if open) and the airport
Devereux Slough (if open) and the new restoration*
Bacara Resort and the emergency revetment fronting the bathhouse*
Sea Walls along Gaviota Coast protecting the railroad (beach narrowing)
Refugio Beach State Park
Hollister Ranch and the under litigation public access point at Cuarta Beach*
Large wave event near the Pierpont neighborhood in Ventura, California
Large wave and tide events in Ventura California
This slideshow requires JavaScript.

What is the littoral cut-off diameter?
Very fine-grained sand, ranging from 0.0625 to 0.125 mm in diameter (4ø to 3ø), typically doesn’t remain on the exposed (dry) portions of most California beaches due to the high-energy wave environment. An investigation of littoral transport processes and beach sand in northern Monterey Bay (Hicks, 1985), discovered that there is a littoral cut-off diameter, or a grain-size diameter, characteristic of any particular segment of coast. The cut-off diameter serves as a functional grain size boundary in that very little material finer-grained than this diameter actually remains on the exposed beach. The cut-off diameter along any particular beach or stretch of coast is primarily a function of wave energy at that location. Studies along the coast of northern Santa Cruz County, which is a relatively high-energy, exposed coast, determined a littoral cut-off diameter of ~0.18 mm (2.5ø) for this stretch of coast, with very little finer sand remaining on the exposed beaches. In southern California, where much of the coast is protected from strong wave action by the sheltering effect of the Channel Islands, the littoral cut-off diameter is smaller, typically around 0.125mm (3ø). When estimating or calculating inputs to a sand budget or planning a beach nourishment project, it is important to consider the littoral cut-off diameter. Sand placed on the beach or entering a littoral cell that is finer than the littoral cut-off diameter will not remain on the dry beach.
